gisprojects
Final Project Workflow Example
Open source or free data sets of location information are few and far between. Based on limited availability, I created my own data sets for two of the four map projections I used in my final project deliverable.
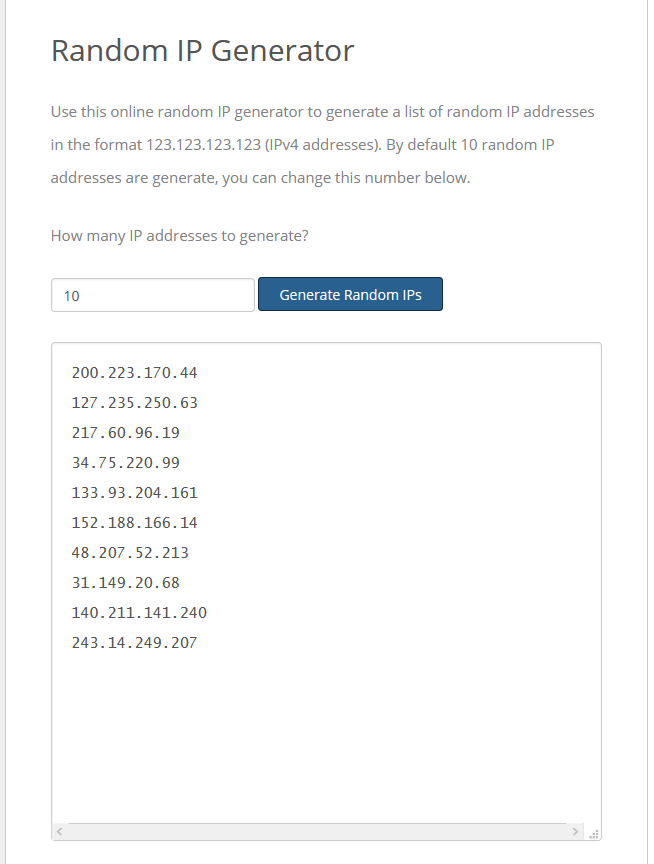
Step 1. Create list of random IP addresses.
I used the Random IP Address Generator to create a list of 10 random IP addresses.
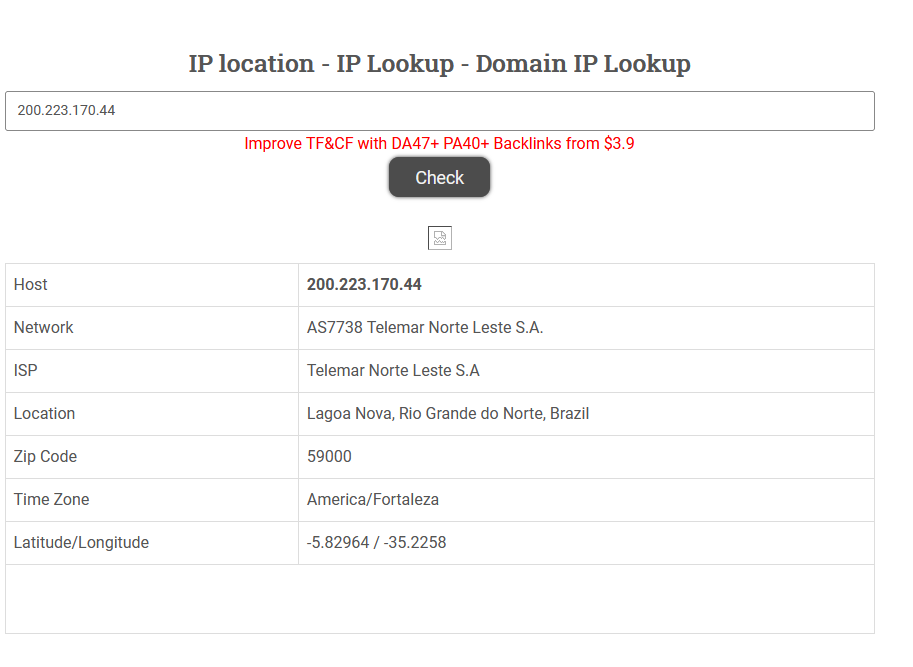
Step 2. Identify IP addresses.
I used the IP Locator to identify the city, state, and countries the IP addresses came from. I also identified the lattitude and longitude.
Step 3. Create the data set.
I created a table with the IP addresses, location, lattitude, and longitute. The examples above do not show the exact data I used to create my map.
Here is the completed data set:
| IP Address | Location | Latitude | Longitude | |
|---|---|---|---|---|
| 139.80.237.224 | Dunedin, Otago, New Zealand | -45.8784 | 170.5201 | |
| 154.27.233.254 | Dowagiac, Michigan, United States | 41.9943 | -86.1159 | |
| 53.16.13.69 | Stuttgart, Baden-Württemberg, Germany | 48.7863 | 9.2381 | |
| 29.127.142.230 | Whitehall, Ohio, United States | 39.9747 | -82.8947 | |
| 62.237.150.253 | Rauma, Satakunta, Finland | 61.1309 | 21.5059 | |
| 48.246.27.7 | Newark, New Jersey, United States | 40.7369 | -74.172 | |
| 97.168.74.232 | New York, New York, United States | 40.7128 | -74.006 | |
| 208.66.77.249 | Woodbury, Connecticut, United States | 41.5511 | -73.2153 | |
| 215.130.235.139 | Whitehall, Ohio, United States | 39.9747 | -82.8947 | |
| 110.65.254.8 | Chongshan, Hainan, China | 18.7771 | 109.52 |
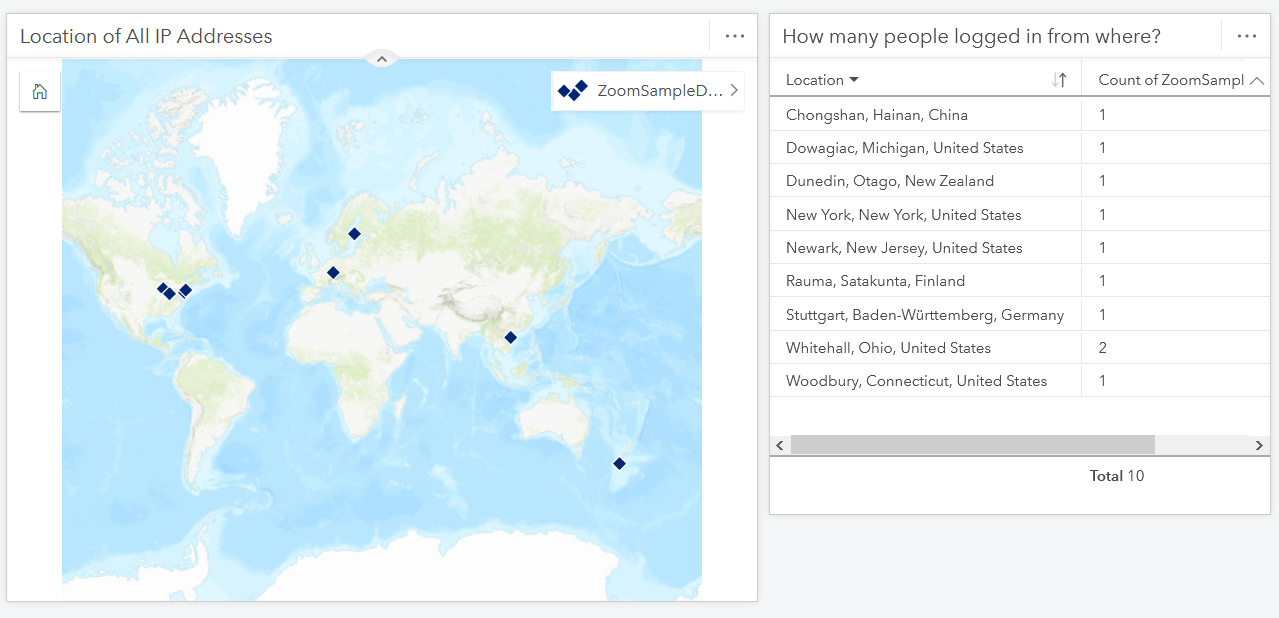
Step 4. Use the data set in a visualization.
I used the above data set to simulate coarse location information collected by Zoom, which only collects and saves IP address location information.
This data was then visualized in a Dashboard using ArcGIS Insights.