gisprojects
Spacial Data Science Visualization
Spacial data science is the part of data science that looks at where and why things happen. Visualization of that data is usually on a map.
Project Purpose
For this assignment, we were using ArcGIS Insights to explore the directional relationship between two variables: pain pill distribution and comsumption.
In this exercise, we center Mingo County, West Virginia as the destination and use Link Analysis to measure both the distributer location and how much they send. Where are the pills coming from and who sends the bulk of them? What is the consumption rate compared to area population?
Output
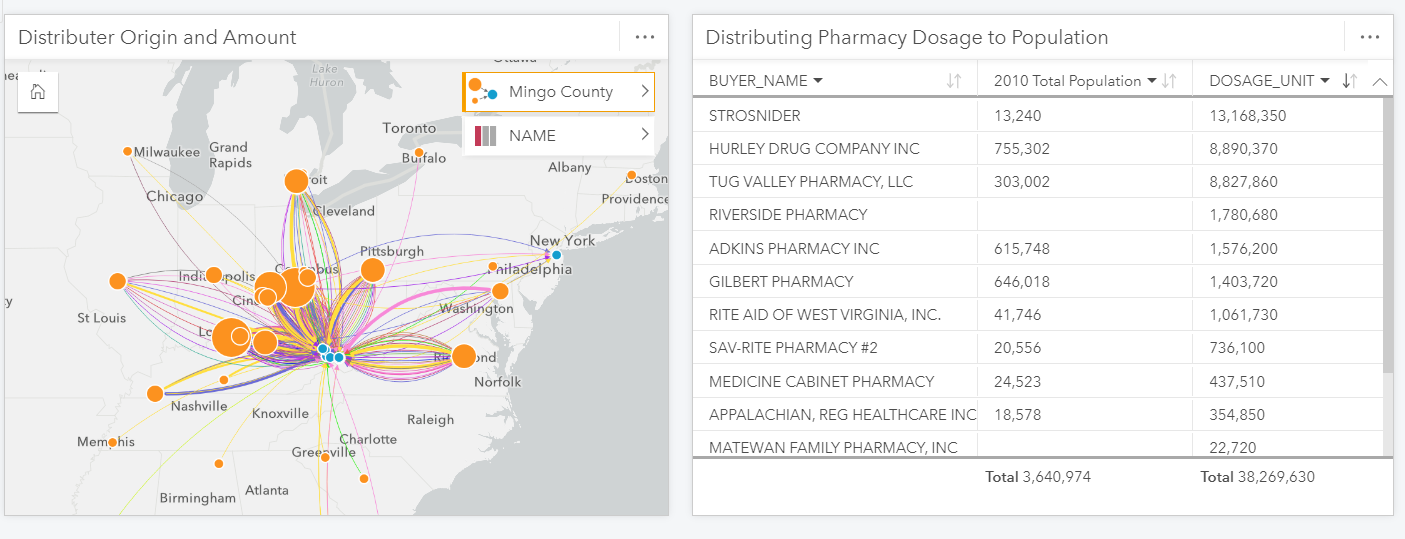
Data Set
We are using a data set from the DEA provided by the Washington Post through their Opiod Files journalism. Accessible: https://www.washingtonpost.com/graphics/2019/investigations/dea-pain-pill-database/